"Processing is an open source programming language and environment for people who want to program images, animation, and interactions. It is used by students, artists, designers, researchers, and hobbyists for learning, prototyping, and production. It is created to teach fundamentals of computer programming within a visual context and to serve as a software sketchbook and professional production tool. Processing is an alternative to proprietary software tools in the same domain."
Processing is a complex data visualization device that converts code to visuals. This can become incredibly complex as seen in some of the work below. Interactivity can also be used with the visuals reacting to movement etc.
Mæve installation @ Venice Biennale 2008 from Maeve installation on Vimeo.

Roots Multi Touch Tangible Installation Teaser from BricK Table on Vimeo.
Roots demo 2 from Memo Akten on Vimeo.
////////////////////////////////////////////////////////////////////////////////////////////////////////////////////////
////////////////////////////////////////////////////////////////////////////////////////////////////////////////////////
NEWS KNITTER
What is News Knitter?
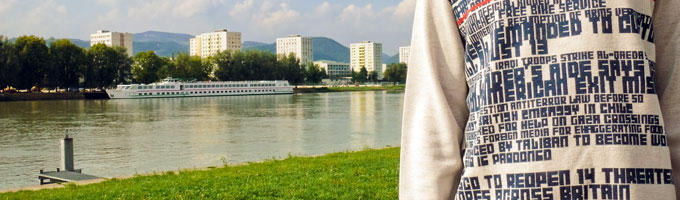
News Knitter is a data visualization project which focuses on knitted garments as an alternative medium to visualize large scale data.
The production of knitted garments is a highly complex process which involves computer support at various steps starting with the designs of both the fabric and the shape of garments until they are ready-to-wear. In recent years, technical innovations in machine knitting have especially focused on the patterning facilities. The patterns are designed by individuals generally depending on the current trends of fashion and the intended target markets and multiplied through mass production. News Knitter translates this individual design process into a world-wide collaboration by utilizing live data streams as a base for pattern generation. Due to the dynamic nature of live data streams, the system generates patterns with unpredictable visuality.
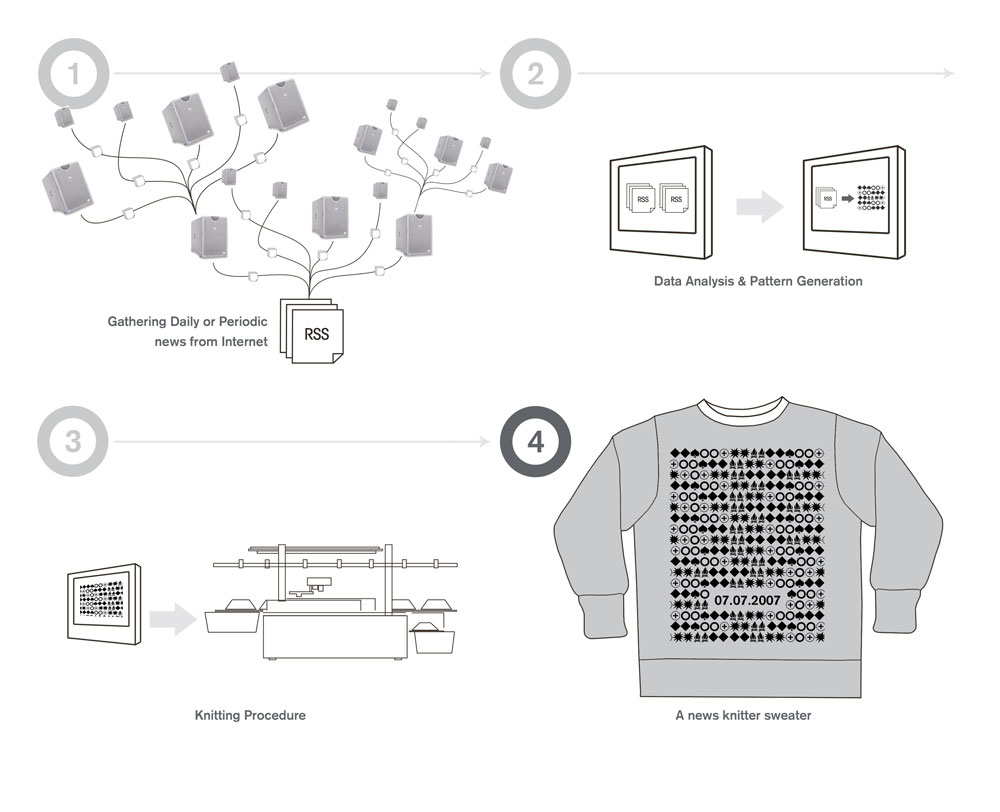
News Knitter converts information gathered from the daily political news into clothing. Live news feed from the Internet that is broadcasted within 24 hours or a particular period is analyzed, filtered and converted into a unique visual pattern for a knitted sweater. The system consists of two different types of software: whereas one receives the content from live feeds the other converts it into visual patterns, and a fully computerized flat knitting machine produces the final output. Each product, sweater of News Knitter is an evidence/result of a specific day or period.
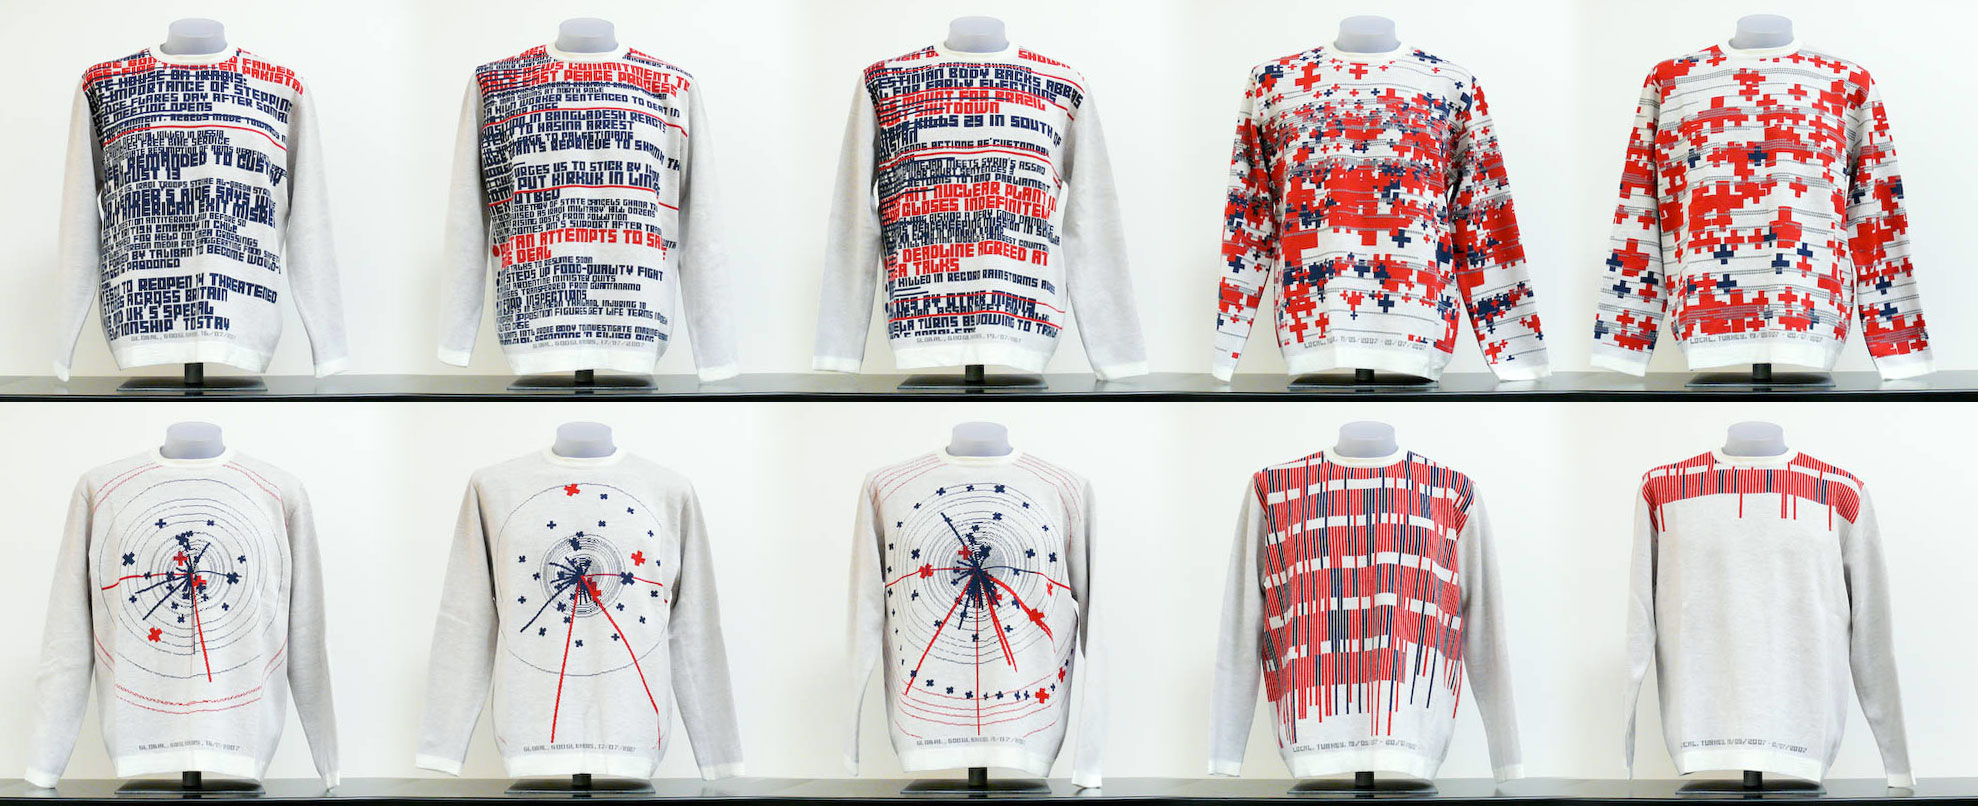
The exhibition consists of ten unique sweaters that are produced as sample outputs of the News Knitter project. The patterns of the sweaters are generated by using online global news of a particular day or local Turkish news of a particular time period.

 :::::::::::::::::::::::::::::::::::::::::::::::::::::::::::::::::::::::::::::::::::::::::::::::::::::::::::::::::::::::::::::::::::::::::
 Interview with jonathan harris( selected questions and answers)
 interview with peter Crnokrak